
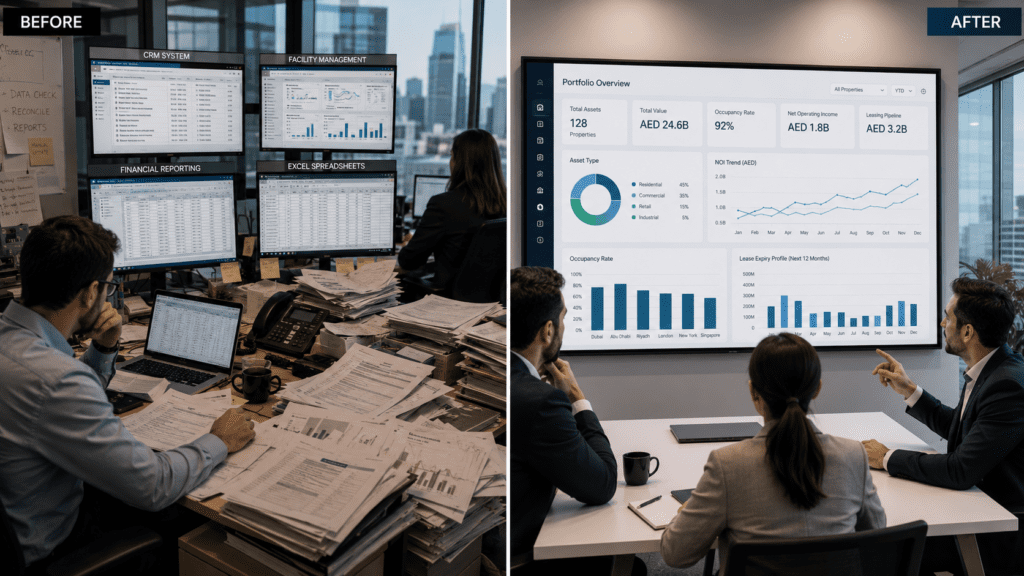
Ask a COO at a global real estate organisation to describe their technology stack and the answer is almost always a list. A CRM for deal management. A separate platform for facilities management. A financial reporting layer that does not talk directly to either. Regional variations where specific markets run different tools for historical or compliance reasons. And somewhere behind all of this, a team of analysts who spend a meaningful portion of their time reconciling data between systems to produce the reports leadership needs.
Each system on that list made sense when it was adopted. Together, they have created a problem that is getting harder to ignore and that the data now clearly supports addressing.
How technology fragmentation happens, and why it feels justified
Real estate organisations rarely build fragmented technology stacks by design. They build them by growth. The CRM that worked for a single-market business gets stretched to cover two markets, then three. A new regional operation comes with its own FM software that the local team knows well and does not want to replace. Finance uses a platform deeply integrated with the ERP that is not easily moved.
At each decision point, the choice to add rather than replace feels like the pragmatic one. Migrations are disruptive. Existing tools work adequately. The pressure to maintain operational continuity is always stronger than the pressure to fix a fragmentation problem that has not yet become visibly expensive.
The problem is that the cost of fragmentation is not a single visible expense. It is a distributed overhead that accumulates across the organisation in analyst time, in decision latency, in the quality of information available when strategic decisions are made.
The hidden cost of running multiple systems
Manual reconciliation overhead
When portfolio performance data lives in four systems, producing a unified portfolio view requires someone to export from each system, reconcile the discrepancies, and synthesise the result into a format usable by leadership. In large organisations, this process runs before every board presentation, investor update, and management review.
The direct cost; analyst hours, is significant but quantifiable. The indirect cost is harder to see: the data reaching leadership is, by the time it has been through this process, typically one to two weeks old. Decisions that could be made on current information are made on recent information. In a market moving at the pace of 2026, that lag has measurable value.
Reporting lag and its effect on strategic decisions
The reporting lag created by a fragmented data environment does not just slow decisions, it affects their quality. A capital allocation decision made against last month’s occupancy and lease expiry data is a decision made in partial information. The cross-geography comparison that would have pointed capital toward an outperforming market is unavailable because the data from that market is still being reconciled.
Organisations that have consolidated onto unified platforms consistently report the same operational change first: the speed at which leadership can get an accurate answer to a portfolio-level question. Decisions that previously required a week of data preparation now take hours.
Cross-geography blind spots
Perhaps the most significant cost of fragmentation in global real estate organisations is the blind spots it creates. Questions requiring data compared across geographies which markets are overperforming, what is the portfolio-level exposure to a single tenant type, where should the next capital allocation go are effectively unanswerable without manual synthesis. And manual synthesis, done under time pressure, is reliable enough for reporting but not precise enough for strategic decision-making.
The leaders who have moved past this describe a specific change: the ability to ask a cross-geography question in a meeting and get an answer in the same meeting. Not a promise to follow up. Not a request to pull the data. An answer, in the room, based on current information.
What triggers the consolidation decision
In most global real estate organisations, the consolidation decision is triggered by one of three events.
Scale
An organisation that has grown beyond a certain number of geographies finds that the manual reconciliation overhead has reached a level that consumes a meaningful portion of the finance and analytics function’s capacity.
Investor reporting pressure
As institutional capital becomes more prevalent in global real estate portfolios, the reporting standards required by investors, real-time data, cross-geography comparability, and consistent metrics across markets cannot be met from a fragmented system environment without a level of manual effort that itself becomes an operational risk.
Team scaling decision
The realisation that the next phase of growth will require adding analyst headcount to maintain current reporting capability rather than adding operational capacity prompts the question of whether the fragmentation is worth what it costs.
The objection that stops most consolidation projects
Any enterprise buyer hearing “move everything onto one platform” reacts the same way. It sounds like concentrating risk, not reducing it. The concern is legitimate, and it comes in three forms.
Single point of failure
If everything runs on one platform, does one outage stop everything? It is the right question to ask. A unified platform does raise the stakes on uptime, and the platform has to earn that trust with enterprise-grade redundancy, security, and recovery standards. The relevant comparison is not one platform against zero risk. It is one accountable provider held to a clear standard against four separate systems, each with its own failure modes and none accountable for the whole.
Vendor lock-in
Consolidating does concentrate dependence on one vendor. What gets missed is that fragmentation already creates dependence, spread across four vendors instead of one, with the integration work between them landing on your team. Lock-in is a real risk worth managing. The way to manage it is contractual and technical: a clear data-export path and open integration standards, agreed before migration, not after.
Migration risk
This is the one that actually stops projects, and for good reason. Migrations are disruptive, and a badly run one is expensive and visible. The answer is not to pretend migrations are easy. It is sequencing. Pilot one geography, validate the data and the integrations under live conditions, then move market by market. The organisation never depends on a single switch being flipped.
What a consolidated platform looks like operationally
The operational model of a consolidated real estate platform is straightforward in principle: one system that every geography feeds into, that every team reports from, and that every strategic decision is made against. In practice, the transition requires careful sequencing such as which geographies move first, how existing data is migrated, which integrations need to be preserved, but the destination state is well-established and well-documented.
Organisations that have made the transition describe the change in operational terms, not technology terms. Reporting meetings change. Investor updates change. The conversations that used to begin with 30 minutes of data reconciliation begin with 30 minutes of strategic discussion. The questions that used to require a follow-up now get answered immediately.
Enterprise real estate organisations running on point solutions pay a hidden cost in manual reconciliation, slow reporting, and blind spots that a consolidated platform eliminates. The organisations consistently outperforming in 2026 are running better information systems, not necessarily better assets.
What this looks like in practice
A large-scale mixed-use developer managing 22,000 units across six business lines: residential sales, residential leasing, retail and commercial leasing, facilities management, owner association, and community services. Before consolidation, each department ran on a separate platform. Call centre and service agents could not see customers’ financial records. Inventory and performance data lived in spreadsheets. Documents were built from manual templates. Producing any cross-department view meant pulling from each system and reconciling it by hand.
After moving all six business lines onto Property-xRM on Microsoft Dynamics 365, the picture changed. Leasing managers got instant access to unit availability and tenant records. Facilities teams saw asset health, technician schedules, and pending SLAs in one place. The lead-to-SPA journey ran with auto-generated contracts. Lease renewal turnaround dropped by up to 40 percent. The platform now tracks more than 40,000 assets and supports 230-plus users across the operation.
The pattern repeats across operators who make this move. They stopped spending time preparing information and started spending it using it.
The strategic case for acting now
The case for consolidation has existed for most of the past decade. What has changed in 2026 is the cost of not acting. As institutional capital raises its reporting expectations, as cross-geography competition intensifies, and as the speed of market change accelerates, the organisations still operating from fragmented data environments are carrying a structural disadvantage that compounds with time.
The organisations that consolidate now will have built three to four years of operational advantage, better decisions, faster reporting, and lower analyst overhead by the time the organisations that delay get around to making the same move.
Platform consolidation is not, ultimately, a technology project. It is an information infrastructure decision with direct consequences for strategic decision quality, investor reporting capability, and the pace at which the organisation can allocate capital accurately. The organisations that have made it describe the same change consistently: they stopped spending time preparing information and started spending it using it. That shift, compounded across every leadership decision made over the following three years, is the real return on the investment.
Plan your next phase of growth with a strategic platform consolidation roadmap.
Frequently Asked Questions
What are the main costs of running a global real estate portfolio on multiple technology systems?
The costs of technology fragmentation in global real estate organisations fall into three categories. Direct costs include analyst hours spent reconciling data across systems before each board or investor presentation, and IT overhead from maintaining multiple platform integrations and vendor relationships. Indirect costs include reporting lag (data reaching leadership 1–2 weeks old, causing decisions to be made on stale information) and cross-geography blind spots (strategic questions requiring manual synthesis that cannot be answered in real time). Structural costs include reduced ability to attract institutional capital, which increasingly requires real-time portfolio reporting across geographies, a standard fragmented systems cannot meet without significant manual overhead.
How do enterprise real estate organisations consolidate their technology stack?
Enterprise real estate technology consolidation typically follows a phased approach: first, identifying the single platform that will become the system of record for all geographies (evaluating CRM, FM, and ERP integration capability); second, piloting in one geography to validate data migration, workflow configuration, and integration performance; third, rolling out to remaining geographies in order of operational readiness; and fourth, retiring legacy point solutions as each geography transitions. The most critical decision is the integration architecture, whether to use a purpose-built real estate operations platform or to connect a best-in-class CRM with ERP and FM systems via API. Purpose-built platforms are increasingly preferred for complex multi-country operations.
What is the ROI of switching to a single real estate operations platform?
The ROI of real estate platform consolidation comes from four sources: analyst time saved (typically 2–5 FTE hours per week per geography eliminated from manual reconciliation), faster decision-making (cross-geography capital allocation decisions that previously took a week now take hours, with compounding strategic value), investor reporting efficiency (the ability to produce institutional-quality cross-geography reports without manual assembly), and operational scalability (each new geography added to a consolidated platform costs a fraction of what adding it to a fragmented multi-system environment costs). Most enterprise organisations see payback within 18–24 months of full platform consolidation.
How does a consolidated real estate platform improve investor reporting for global portfolios?
Investor reporting quality improves when portfolio data is consolidated in three specific ways: data recency (real-time or same-day portfolio data replaces 1–2 week-old reconciled data), cross-geography comparability (consistent metrics across all markets without manual normalisation), and drill-down capability (investors or analysts can go from portfolio-level to asset-level data without requesting additional exports). For global real estate organisations managing institutional capital, these improvements are not quality-of-life upgrades, they are increasingly a baseline requirement, as institutional LPs now routinely expect real-time portfolio visibility in their co-investment and fund reporting standards.
What triggers the decision to consolidate real estate technology at enterprise scale?
Three events most commonly trigger the consolidation decision. First, a scaling threshold, typically when an organisation crosses 5–7 geographies and finds that the analyst overhead required to maintain coherent portfolio reporting has become a material cost centre. Second, an investor or board reporting failure, when a strategic question asked in a leadership meeting cannot be answered without a week of data preparation, making the fragmentation visible to the people who control resource allocation. Third, a competitive pressure event, when a peer organisation or competitor demonstrates faster decision-making or superior portfolio transparency that is directly attributable to better information infrastructure. The third trigger is becoming more common as the proptech consolidation wave produces increasingly visible performance differences.

 Apr 19, 2022