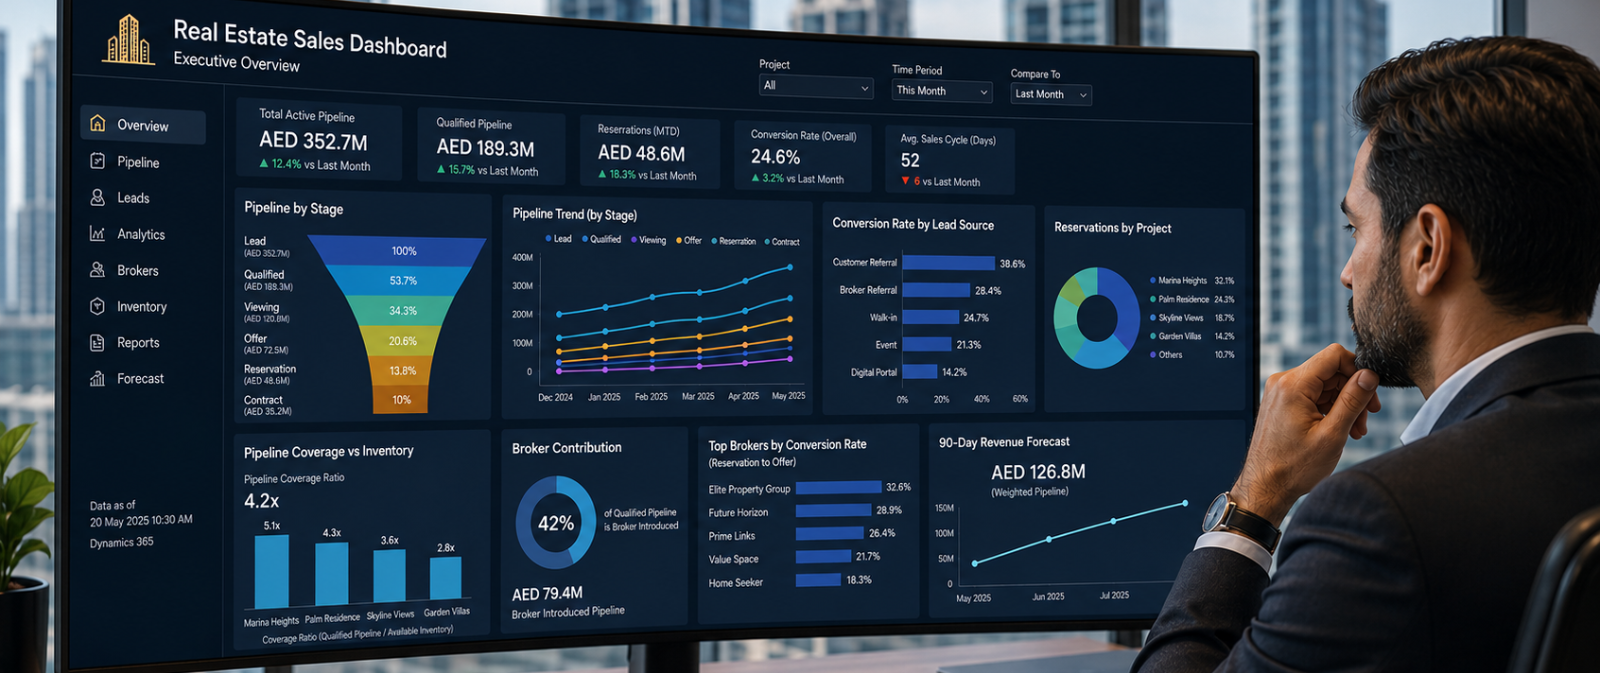
A properly configured real estate CRM captures data at every stage of the buyer journey; lead source, qualification rate, time at each pipeline stage, broker contribution, inventory match, and payment conversions that can predict where the next deal is coming from and identify exactly where current deals are stalling. Connected to Power BI, Microsoft Dynamics 365 and Property-xRM turn that data into live sales dashboards, conversion funnel analytics, broker performance reports, and 30/60/90-day revenue forecasts, giving sales directors the visibility to manage by data, not by gut feel.
Key Takeaways
- Most real estate sales teams manage pipelines on weekly Excel updates. A live CRM dashboard replaces that with real-time pipeline visibility, funnel analytics, and broker performance data.
- Five metrics matter most: lead-to-qualification rate, pipeline velocity, conversion rate by source, inventory coverage vs active pipeline, and broker contribution rate.
- Power BI connected to Dynamics 365 gives Microsoft-stack buyers cross-department reporting capabilities; sales, FM, finance, and inventory in one model that standalone CRM reporting cannot match.
- CRM data identifies conversion bottlenecks before they become revenue problems: a drop at offer stage signals a pricing issue; a long contract stage signals document friction.
- A stage-weighted revenue forecast built on live CRM data gives the board a defensible 90-day revenue number, not a spreadsheet extrapolation.
The problem with managing sales on gut feel and weekly reports
Ask a Sales Director at a real estate development company how they manage their pipeline and the answer is usually a variation of the same process: a weekly Excel update compiled by the sales admin team, a call with each agent on Monday morning, and a number presented to the CEO on Friday that nobody entirely trusts.
This is not a failure of the people involved; it is a failure of the data infrastructure available to them. A real estate CRM that is properly configured and actively used captures data at every stage of the buyer journey: where each lead came from, how long it spent at each pipeline stage, which agent managed it, which unit was offered, whether it was broker-introduced, and at what stage it converted or dropped off.
That data, accessible in real time, visualised in a Power BI dashboard connected to Dynamics 365 gives a sales director the ability to manage their team and their pipeline with the same precision that a Finance Director applies to a cash flow model. The difference is not the ambition; it is the infrastructure.
This article covers the five metrics that matter most, what a real estate sales dashboard looks like in practice, how Power BI extends what CRM reporting can do, how to identify and fix conversion bottlenecks, and how to build a revenue forecast from live pipeline data rather than historical extrapolation.
The five metrics every real estate sales team should track
Not all CRM data is equally useful. The five metrics below represent the highest-signal data points in a real estate sales operation; the ones that, when tracked consistently, give a Sales Director the earliest warning of both opportunity and risk.
| # | Metrics | What It Measures | Benchmark | Low Performance Signals |
| M1 | Lead-to-Qualification Rate | The percentage of leads captured in the CRM that reach the ‘qualified’ stage within a defined timeframe. | 25–35% for a mixed-source lead pool in a competitive GCC market. Higher for direct and referral channels. | A low rate signals poor lead quality from specific sources, insufficient follow-up speed, or qualification criteria that are too tight for the current inventory mix. |
| M2 | Pipeline Velocity – Time Per Stage | The average number of days a deal spends at each pipeline stage: lead, qualified, viewing, offer, reservation, contract. | Benchmark against your own historical data by project type. Off-plan residential typically runs 45–70 days from qualification to reservation. | A stage where time increases month-on-month is a bottleneck. Rising time at offer stage usually means a pricing or product problem. Rising time at contract stage usually means a process problem. |
| M3 | Conversion Rate by Lead Source | Reservation rate broken down by how the lead originated: digital portal, broker referral, walk-in, event, customer referral. | Direct and customer referral leads typically convert at 1.5–2× the rate of portal leads. Broker leads vary significantly by broker quality. | Low conversion from a high-volume source is a budget allocation problem. High conversion from an under-resourced source is a scaling opportunity. The data tells you which is which. |
| M4 | Inventory Coverage vs Active Pipeline | The ratio of active qualified pipeline to available inventory, by unit type and project. | Pipeline coverage should be 3–5× available inventory at qualification stage. Below 3× risks a gap; above 6× risks wasting sales resource on units that cannot be delivered. | Oversold unit types create booking conflicts and broker disputes downstream. Undersold types signal a product or pricing problem or insufficient sales focus. Both are actionable. |
| M5 | Broker Contribution Rate and Broker Conversion Quality | The percentage of qualified pipeline that is broker-introduced, and the reservation-to-offer conversion rate per broker. | Broker contribution of 35–45% is typical for GCC mid-market residential. Quality matters more than volume. A broker generating 50 leads at 8% conversion is less valuable than one generating 20 at 30%. | High volume and low conversion from specific brokers signals low-intent referrals. CRM data makes this visible. Without it, every broker relationship looks equally valuable. |
What a real estate sales dashboard looks like in practice
The dashboard below is a Power BI view connected to Dynamics 365 and Property-xRM, showing the live state of a multi-project residential sales operation. Each panel answers a different question for the sales director.
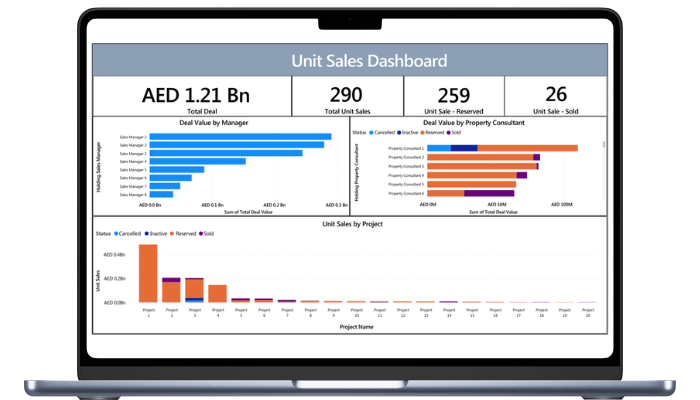
The Deal Value by Manager panel ranks the sales managers by the value they are holding. Sales Manager 1 through 3 are carrying the majority of the pipeline, while Managers 6 through 8 sit well below. That distribution tells the sales director where deal value is concentrated and where coaching or reallocation may be needed before it becomes a single-point-of-failure risk.
The Deal Value by Property Consultant panel breaks the same value down a level, colour-coded by status: reserved, sold, inactive, and cancelled. Consultant 1 is the clearest signal on the board. A significant share of their value sits in cancelled and inactive, not reserved or sold, which is exactly the kind of quality problem that raw deal-value rankings hide. We look at the colour mix, not just the bar length.
The Unit Sales by Project panel shows where the value lives across the portfolio. Project 1 dominates, carrying more reserved value than the next three projects combined, while the long tail of projects from 8 onward contributes very little. For the sales director this raises two questions before the next review: is Project 1 over-concentrated, and is the tail being actively sold or quietly stalling.
This is what data-driven sales management looks like in practice. Not a weekly spreadsheet. A live view that asks a specific question every time it is opened: what do we need to do differently this week?
Power BI for real estate: The Microsoft advantage
Standalone CRM reporting, the built-in dashboards inside Dynamics 365 or Salesforce covers sales-side data well. Power BI connected to Dynamics 365 and Property-xRM extends significantly, because it can pull data from every module of the real estate operations platform into a single reporting model.
| Power BI + Dynamics 365 : What standalone CRM reporting cannot do |
| Cross-department data Sales, FM, leasing, and finance data unified in a single Power BI model. No manual exports, no reconciliation gaps. Multi-project views Compare pipeline velocity, conversion rates, and inventory coverage across every active development, side by side. Inventory × pipeline overlap See which unit types are oversold relative to available inventory in real time, before the sales team creates a booking conflict. Custom executive dashboards Board-level reporting built on live CRM and finance data, not a spreadsheet assembled on Thursday afternoon for a Friday meeting. |
The cross-department capability is where the Microsoft-stack advantage becomes most visible. A real estate sales director who can see pipeline data alongside inventory availability, FM maintenance backlog on units being prepared for handover, and collections performance on payment plans in a single dashboard is operating with a level of situational awareness that no standalone CRM product can provide.
For a detailed breakdown of how each Dynamics 365 module contributes to the real estate operations platform: Microsoft Dynamics 365 for Real Estate: What Each Module Actually Does.
Using analytics to find and fix conversion bottlenecks
The most immediate actionable use of real estate CRM analytics is identifying where deals are stalling and diagnosing why. The five scenarios below are the most common bottlenecks visible in real estate sales pipeline data, along with what the data looks like and what it signals.
| Data signal | What it looks like in the data | What it likely means and what to do |
| Drop at qualification → offer | High number of qualified leads but low offer rate; long time-at-qualification stage | Pricing misalignment or inventory mismatch. Sales team is qualifying buyers the available inventory cannot satisfy. Review unit type mix vs buyer profile data. |
| Long time at contract stage | Average days at contract stage significantly above benchmark; high variance between agents | Document or approval friction. SPA turnaround is slow, approval chains are unclear, or DocuSign integration is missing. Process review required. |
| High broker contribution, low conversion | Brokers generate 40%+ of leads but convert at half the rate of direct leads | Broker quality issue. High volume, low-intent referrals from specific broker accounts. Use broker leaderboard data to identify and address underperformers. |
| Pipeline concentration risk | 70%+ of pipeline value in one project or one sales agent | Over-dependence on a single asset or individual. If the project delays or the agent leaves, pipeline collapses. Redistribute focus with data-backed targets. |
| Inventory coverage gap | Active pipeline significantly exceeds available inventory for a specific unit type | Overselling risk. Sales team is continuing to qualify buyers for units that are nearly exhausted. Inventory visibility must be surfaced in the sales dashboard in real time. |
Each of these signals is invisible without CRM data. With it, the Sales Director has a specific question to answer in the next team meeting, a specific conversation to have with the pricing or product team, and a specific change to make to the sales process grounded in evidence rather than instinct.
Forecasting: From pipeline to revenue
A reliable revenue forecast is one of the most valuable outputs a CRM can produce for a real estate business and one of the least well understood. Most developers produce revenue forecasts by extrapolating from historical sales rates or by asking agents to estimate their closings for the month. Both methods are inaccurate because they do not account for the current state of the pipeline.
A stage-weighted revenue forecast uses three inputs: the number of active deals at each stage, the historical close probability for each stage, and the average unit value for the relevant project and unit type. The result is a weighted revenue number that reflects the current pipeline’s realistic conversion potential not an agent’s optimism.
| Pipeline stage | Close probability | # active deals | Avg unit value | Weighted forecast |
| Offer made | 60% | 168 | AED 1.8M | AED 181M |
| Reserved | 85% | 94 | AED 1.8M | AED 144M |
| Contracted | 97% | 51 | AED 1.8M | AED 89M |
| 90-day weighted revenue forecast | AED 414M | |||
The forecast above produces a 90-day weighted revenue number of AED 414M from 313 active deals across three pipeline stages. This number is defensible because it is derived from live pipeline data with stage-appropriate probability weightings, not from an agent headcount multiplied by a target.
For the forecast to be accurate, three data inputs must be maintained in the CRM: consistent stage progression so that deals move through the funnel based on defined criteria rather than agent preference; accurate unit value data pulled from the inventory module in real time; and historical conversion rates calibrated by project type, unit type, and sales channel. Property-xRM on Dynamics 365 maintains all three and refreshes the forecast automatically as the pipeline changes.
Related reading
For the full operational picture of how CRM data connects across every stage of the real estate buyer journey, read From First Lead to Handover: How Real Estate Developers Use CRM to Manage the Full Buyer Journey.
Conclusion: Your CRM already has the answers, if you can read the data
Every real estate CRM that is actively used is already capturing the data described in this article. Leads are being logged. Deals are progressing through stages. Brokers are being attributed. Units are being matched to buyers. The question is not whether the data exists, it is whether the organisation has the reporting infrastructure to read it.
A Power BI dashboard connected to Dynamics 365 and Property-xRM converts that operational data into the five metrics, the conversion funnel, the broker leaderboard, and the revenue forecast that give a Sales Director genuine control of their pipeline, not just visibility of where it was last week.
The developers who are outperforming their market in conversion rate and revenue predictability are not doing something fundamentally different in their sales process. They are making decisions from better data, faster. That is the competitive advantage that CRM analytics delivers and it is available on the infrastructure you are likely already considering.
See what your real estate sales data can tell you
See what a live Property-xRM and Power BI sales dashboard looks like for your portfolio, with the Metadata team.
FAQ
What CRM metrics matter most for real estate sales?
The five highest-signal CRM metrics for real estate sales are: lead-to-qualification rate (quality of lead capture), pipeline velocity (time per stage, indicating process efficiency), conversion rate by lead source (return on each channel), inventory coverage vs active pipeline (over or underselling risk by unit type), and broker contribution and conversion quality. Together, these metrics give a Sales Director a complete picture of pipeline health and where to focus management attention.
What is a sales pipeline report in real estate CRM?
A sales pipeline report in real estate CRM shows the current state of all active deals across pipeline stages; from lead and qualification through viewing, offer, reservation, and contract. It displays the number of deals at each stage, the aggregate value, the average time spent at each stage, and the conversion rates between stages. When connected to Power BI, a pipeline report becomes a live dashboard that refreshes as deals progress, giving the Sales Director real-time visibility rather than a weekly snapshot.
How do you use Power BI for real estate sales reporting?
Power BI connects to Dynamics 365 and Property-xRM to pull sales pipeline data, inventory availability, payment plan status, and broker performance into a unified reporting model. A real estate sales dashboard in Power BI typically shows open pipeline by project, the conversion funnel by stage, lead source breakdown, broker leaderboard, average deal cycle time, and a stage-weighted revenue forecast. The key advantage over CRM-native reporting is the ability to combine sales data with FM, finance, and inventory data in a single view.
How do you track broker performance in a real estate CRM?
Broker performance is tracked in a real estate CRM by measuring four metrics per broker: lead volume introduced, qualification rate of those leads, conversion rate from qualified lead to reservation, and average deal cycle time. A broker leaderboard in Property-xRM ranks brokers on conversion quality rather than raw lead volume, separating high-intent referrers from high-volume, low-conversion relationships. This data feeds directly into broker commission calculations, tier reviews, and allocation decisions.
What is CRM forecasting in real estate?
CRM forecasting in real estate is the process of projecting revenue from the current pipeline using stage-weighted probability. Each deal at each pipeline stage is assigned a close probability derived from historical conversion data. That probability is multiplied by the deal’s unit value to produce a weighted contribution to the total forecast. Aggregated across the pipeline, this gives a 30/60/90-day revenue projection that is significantly more accurate than extrapolating from historical sales rates or asking agents to estimate their monthly closings.
How do CRM dashboards improve real estate sales team performance?
CRM dashboards improve real estate sales team performance by making individual and team performance visible in real time. An agent can see their own pipeline, their conversion rates, and how their performance compares to team benchmarks. A Sales Director can see which agents are behind on follow-up, which are losing deals at a specific stage, and which are consistently overestimating closings in their forecasts. Visible data changes behaviour and in a commission-driven sales environment, that effect is significant.

 Apr 19, 2022