
Key takeaways
- Metrics that appear universal, like occupancy rate, are often measured differently across geographies, making direct comparison misleading without shared definitions.
- The currency translation and cost structure problem means financial benchmarks need multiple reporting layers to separate operational performance from structural and market differences.
- Effective cross-geography benchmarking is built on a KPI dictionary agreed before any platform or dashboard decision is made, not after implementation.
- Like-for-like comparison is most reliable within asset class and market maturity groupings, not across all geographies in a single consolidated ranking.
- Technology enforces consistent definitions once they are agreed. It cannot determine what those definitions should be or resolve disagreements between markets.
Comparing performance across geographies in a global real estate portfolio is more difficult than it appears from the outside. The data is in different systems. The definitions are inconsistent. The cost structures differ. The lease norms differ. Even the reporting cadences are different.
Most global real estate organisations manage this by producing a consolidated portfolio report once a quarter, which requires several days of analyst time and still contains caveats about data comparability across markets. The number on the slide is accurate in the sense that it represents what each geography reported. Whether it is comparable is a different question.
The organisations that have solved cross-geography benchmarking are not the ones with the most sophisticated analytics tools. They are the ones that did the definitional work first, before the technology, before the dashboard, before the reporting cadence. That sequence matters more than the platform choice.
Why like-for-like benchmarking fails without shared definitions
The most common failure in cross-geography benchmarking is trying to compare metrics that look the same but are measured differently. Occupancy rate appears to be a universal metric. In practice, one market calculates it as units leased divided by units available. Another calculates it as square footage leased divided by total leasable area. A third excludes units under refurbishment from the base. All three call the output “occupancy rate.” None are measuring the same thing.
The same problem applies to pipeline metrics, lease duration, net operating income, cost-per-unit, and capital expenditure ratios. Each market has developed its own measurement convention, often driven by local investor reporting norms or historical practice that predates any interest in cross-geography comparison. When those conventions are aggregated without harmonisation, the portfolio-level figure is technically derived from real data and practically meaningless for comparison purposes.
Most global real estate organisations discover this when leadership asks a cross-geography question and the answer requires a footnote. The occupancy figure is 87 percent but note that the Singapore calculation uses a different base, and the Tokyo figure excludes two properties under refurbishment. That footnote is the signal that the benchmark is not working. The longer it takes to notice, the more decisions have been made on data that was not comparable.
The currency and cost structure problem
Currency translation is the most visible complication in cross-geography comparison. Revenue in AED, JPY, SGD, and USD needs a base currency for portfolio-level reporting. That translation introduces volatility that can mask or amplify underlying performance differences. A geography that appears to be underperforming on revenue may simply be in a currency that has weakened against the reporting base. A quarter of strong performance in Tokyo can look like a flat result when translated to USD at a spot rate that moved 8 percent in the same period.
Cost structure differences are less visible but often more significant for operational benchmarking. Maintenance costs, staffing costs, regulatory compliance costs, and property tax structures vary substantially across APAC and MENA markets. A direct cost-per-unit comparison between a Tokyo operation and a Dubai operation tells the portfolio head almost nothing about relative operational efficiency without accounting for structural cost differences that neither market can control.
Organisations that benchmark effectively across geographies solve this by reporting on multiple layers simultaneously: absolute figures in local currency for operational management at the market level, translated figures in base currency with a volatility note for financial reporting, and efficiency ratios that normalise for structural cost differences for cross-geography operational comparison. Each layer answers a different question and serves a different audience.
What a working cross-geography benchmark looks like
A functional cross-geography benchmark is built on three components: a shared KPI dictionary, a common reporting cadence, and a comparison methodology that accounts for structural differences between markets rather than ignoring them.
The KPI dictionary is the foundation. It defines exactly how occupancy, pipeline, cost, revenue, and renewal are calculated in every geography, agreed in advance, documented, and enforced through the reporting platform. The definitions do not need to match local investor reporting conventions exactly. They need to be internally consistent, so that a number from Singapore and a number from Dubai carry the same meaning when they appear in the same portfolio report. Without the dictionary, the platform has nothing reliable to enforce.
The comparison methodology determines how geographies are grouped for benchmarking purposes. Like-for-like comparison is most useful within asset class and market maturity groupings: mature residential markets compared to each other, emerging commercial markets compared to each other, stabilised assets compared to lease-up assets. Grouping all geographies in a single ranking that mixes dissimilar operations produces a ranking that leadership cannot act on, because the variables driving the outcome are structural, not operational.
Building the governance layer for shared KPIs
The governance work required for cross-geography benchmarking is almost always underestimated. Getting regional teams to agree on shared definitions requires resolving conflicts between local practices and portfolio-level requirements. Some local teams have strong reasons for their current conventions, rooted in how local investors or regulators expect to see the data. Others have simply never been asked to document how they measure things, which creates a different kind of difficulty.
Organisations that navigate this well do it through a joint exercise rather than a headquarters mandate. Regional leads participate in defining the shared KPI framework. That gives them ownership of the result and reduces resistance to the reporting change. It also produces definitions that reflect on-the-ground realities rather than theoretical constructs that break down when the data team tries to populate them from live systems.
The output of the governance exercise is the KPI dictionary: a documented definition for every metric used in portfolio-level reporting, with notes on how it differs from local convention where relevant. That document becomes the reference point for every future reporting discussion. When a new geography is added to the portfolio, the KPI dictionary is the onboarding document for their reporting team, and the platform configuration is updated to match it rather than the other way around.
How technology enables rather than solves the benchmarking challenge
Technology is often presented as the solution to cross-geography benchmarking. A consolidated platform will give you the data in one place and the benchmarks will follow. This framing is partially accurate and significantly incomplete. It is accurate that a consolidated platform makes consistent benchmarking operationally possible at scale. It is incomplete because the platform enforces whatever definitions it is given, whether those definitions are consistent or not.
Organisations that implement a consolidated platform without doing the definitional work first typically find that the platform produces cross-geography reports with the same comparability problems as the manual approach, delivered faster. The footnotes move from the analyst notes into the dashboard configuration. The underlying problem has not been solved. It has been industrialised, which makes it harder to fix because the data now looks authoritative.
The correct sequence is definitional work first, platform configuration second. The platform is then a tool for enforcing consistency, running reports without manual synthesis, and flagging when a geography’s data falls outside expected ranges. That is where the technology value is concentrated. Not in the KPI design, which is a governance problem, and not in the comparison methodology, which is an analytical problem.
What leadership gets when benchmarking works
When cross-geography benchmarking is working, the questions that previously required analyst exercises become standard meeting discussions. Which geography is outperforming on occupancy adjusted for market conditions? Where is the portfolio most exposed to single-tenant concentration? Which market has the highest cost-per-unit relative to its peer group and what explains it? These are the questions leadership wants to ask. They are usually deflected because the data to answer them is not reliable.
Those questions can be answered from a live dashboard when the underlying definitions are consistent and the methodology accounts for structural differences. The answer does not require a footnote about data comparability because the comparability problem has been resolved at the source. The conversation moves from explaining the data to acting on it.
The strategic value is not only in the questions that can be answered. It is in the questions leadership starts asking once they trust the data. Portfolio reallocation decisions, geographic expansion priorities, and operational investment choices become better calibrated when the benchmark is reliable. The mental discount that leadership applies to uncertain data disappears, and the analysis starts driving decisions rather than framing caveats around them.
How Metadata Technologies helps
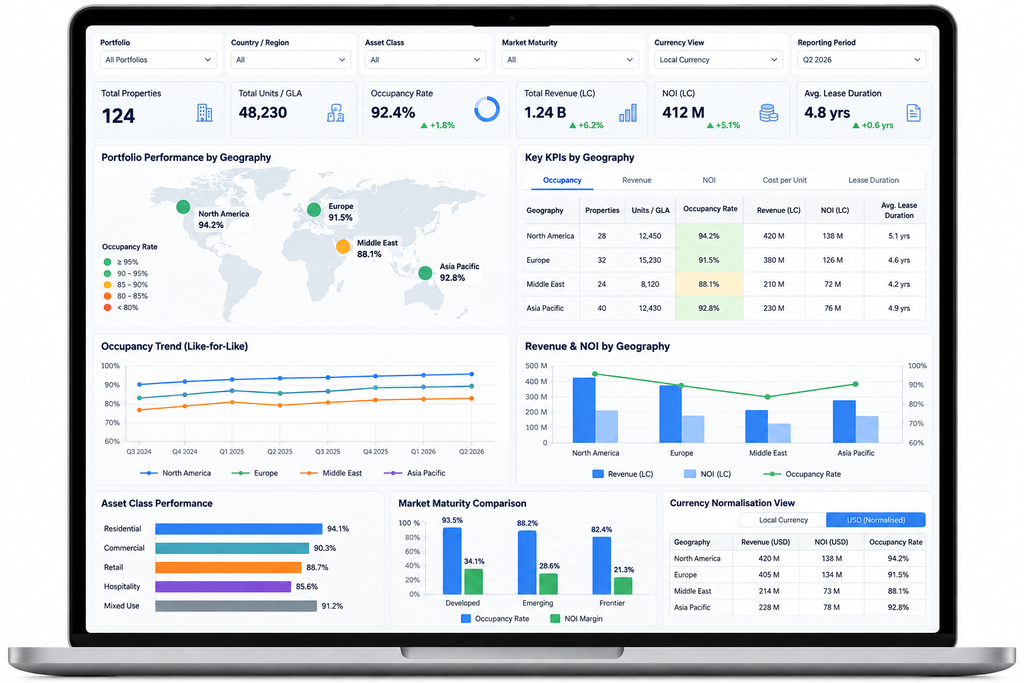
Metadata Technologies maintains a shared data layer and reporting architecture across all geographies in a consolidated portfolio, with country-level configuration for local compliance requirements, currency, and lease structures.
Cross-geography performance reports, including like-for-like comparison by asset class and market maturity grouping, are generated from one system without manual synthesis. The KPI dictionary is built into the platform configuration so that definitions are consistent by default.
If your organisation is working on cross-geography benchmarking and wants to see how the reporting architecture works in a multi-country deployment, reply to this email and we will connect you with our enterprise advisory team.



FAQ
Where should a global real estate organisation start with cross-geography benchmarking?
The starting point is a KPI audit: documenting what each geography currently measures, how it measures it, and where the definitions diverge. This is typically a two-to-three-week exercise with representatives from each major geography. The audit produces a list of the five to ten metrics where definitions conflict most significantly. Resolving those conflicts, before any platform or dashboard decision is made, is the work that makes cross-geography benchmarking possible. Starting with a platform before the audit is done typically results in a faster version of the same comparability problem.
How do you handle markets where local investor reporting requirements conflict with portfolio-level definitions?
The solution is a two-layer reporting architecture: one layer uses the shared portfolio definitions for internal benchmarking and leadership reporting, and a second layer produces locally compliant reports for each geography using local definitions. This requires a platform that can maintain both configurations simultaneously without one overwriting the other. The key is that the internal benchmark is calculated consistently regardless of what local reporting requires, so the portfolio view is not distorted by local convention.
How many metrics should be included in a cross-geography portfolio benchmark?
A functional benchmark is typically built on five to eight core metrics per asset class. For residential portfolios, those usually include occupancy rate, renewal rate, net operating income per unit, maintenance cost per unit, and average vacancy duration. More metrics can be added once the core set is working consistently, but a benchmark with 20 metrics inconsistently defined across markets is less useful than a benchmark with six metrics measured the same way everywhere. Start narrow, make it reliable, then expand.
How do you account for currency volatility in cross-geography performance comparison?
Currency volatility is best managed by reporting operational performance in local currency for management purposes and using a fixed-rate translation for period-over-period portfolio comparison rather than spot rates. Spot rate translation introduces volatility that reflects currency movements rather than operational performance. Using a fixed rate, typically the average rate for the reporting period or a rate fixed at the beginning of the financial year, isolates operational performance from currency effects for comparison purposes.
How do you get regional teams to adopt shared definitions when they conflict with local practice?
Adoption is highest when regional teams are involved in defining the shared framework rather than receiving it as a mandate. The most effective approach is a facilitated working session where regional leads propose definitions and the group resolves conflicts together. The output is documented as a joint product, not a headquarters decision. Regional teams that helped write the KPI dictionary are significantly more likely to report against it accurately than teams that received it as an instruction from the centre.
What is the difference between a portfolio dashboard and a cross-geography benchmark?
A portfolio dashboard aggregates data from multiple geographies into a single view, but the aggregation masks comparability problems if the underlying definitions are not consistent. A cross-geography benchmark is a structured comparison that uses consistent definitions, accounts for structural differences between markets, and groups geographies appropriately for like-for-like comparison. A dashboard is a reporting tool. A benchmark is an analytical framework. The dashboard is only as useful as the framework behind it is sound.
How often should cross-geography benchmarks be reviewed and updated?
The KPI definitions should be reviewed annually at minimum, and whenever a new geography is added to the portfolio or a significant change in local market structure makes an existing definition inadequate. The benchmark results should be reviewed on the same cadence as the portfolio management cycle, typically monthly for operational metrics and quarterly for strategic performance metrics. The KPI dictionary should be treated as a live governance document rather than a static output from the initial exercise.

 Apr 19, 2022